When your feedstock arrives as chips and sawdust.
A mill running residues from dozens of suppliers can't hand a regulator one plot's coordinates — the wood is commingled and the chain is many-to-many. LandTrace verifies the whole supply shed against the EU's own forest maps, so you account for the harvest base feeding the stream without chasing a plot you can't trace.
Residue streams break the usual approach.
Sawdust, chips, and shavings are in scope (Annex I), but the obligation still reaches back to the harvest — and the standard "geolocate the plot" workflow simply doesn't apply.
You can't trace every particle
Residues are pooled across thousands of logs from many plots. Asking each mill for boundaries rarely works — they often can't trace it either.
Mass balance is prohibited
EUDR requires segregation, not paper averaging. You need to account for the actual harvest base feeding the stream.
Flagging buries you
Generic tools read every clearcut as loss, so legitimate rotational harvest floods the system with false positives.
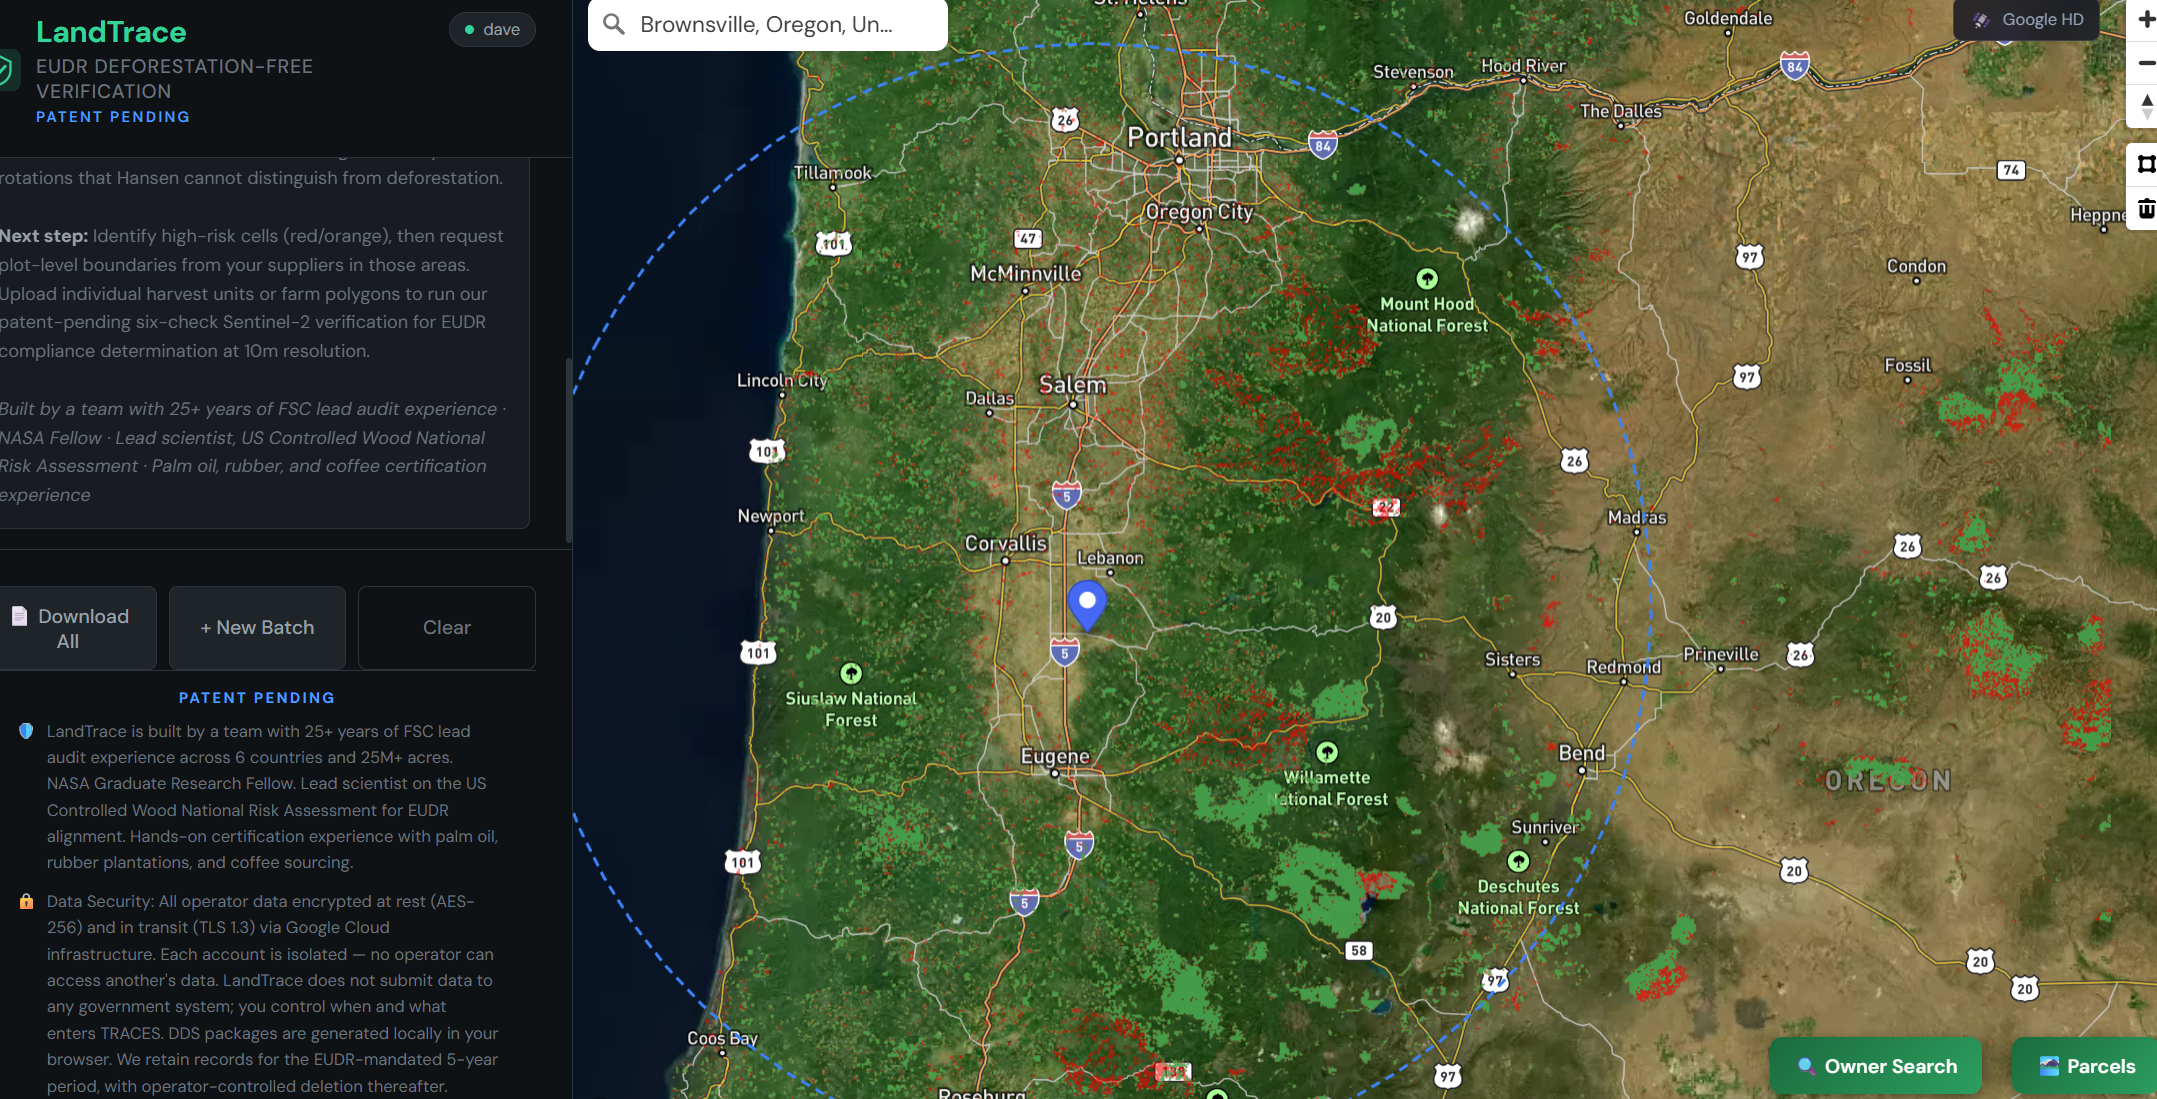
Verify the supply shed, then sample what matters.
LandTrace reads canopy change against the EU's 2020 forest baselines and silviculture-aware analysis — so managed harvest clears and effort concentrates on genuine conversion and degradation.
Map the supply shed
Each supplying mill's procurement catchment — its "wood basket" — becomes the unit of assessment, bounded conservatively from haul economics and tightened with actual flows.
Coarse multi-layer screen — green / red
Hansen flags post-2020 loss; GFC 2020 supplies the forest-extent baseline that defines conversion; GFT 2020 ranks it by type so loss in primary forest outranks loss in plantation.
Hansen GFCGFC 2020 V3GFT 2020Six-check on a sample of the red
A statistically defensible sample runs through the silviculture-aware six-check Sentinel-2 pipeline at 10 m — classifying each as green, yellow, or red. Footprints come from imagery, so it never stalls on supplier paperwork.
Sentinel-2 · 10 mprimary-forest firstClear with the record
Yellow and red false positives are reconciled against public harvest records — Oregon FERNS, Washington FPARS, California THP — with wildfire and salvage ruled out, plus supplier attestation where no public record exists.
FERNS · FPARS · THPattestationGenerate the DDS
A geolocation backbone, per-shed and per-plot evidence, a documented negligible-risk conclusion, and a TRACES-ready Due Diligence Statement — client-side, retained 5 years.
TRACES-readyclient-sideInterpretation, not just capture.
Silviculture-aware
Managed harvest clears instead of lighting up red, so a managed-forest shed doesn't drown you in false positives.
No supplier-traceability dependency
Harvest footprints come from imagery, so verification doesn't break when a mill can't trace commingled residues to a plot.
The EU's own reference layers
Loss is read against GFC 2020 and GFT 2020 — the same maps Competent Authorities use — with the reasoning exposed.
Defensible by design
Built to be attested by a qualified forester and to withstand a substantiated-concern challenge.
Verify your residual sourcing.
Draw a sourcing shed, run the screen, and start building a defensible EUDR file — or walk through your supply base with us.